Physics students often overlook a very powerful tool (a velocity vs time graph) when they are trying to calculate distance traveled when given information about velocity and/or acceleration. The important thing to realize is that the distance traveled is the area underneath the graph of velocity-vs-time, and this will often make solving certain types of problems much easier.
For example, consider the three graphs below detailing distance-vs-time, velocity-vs-time, and acceleration-vs-time:
|
Specifically, let’s examine the motion in between t = 4s and t = 7s (the first pair of vertical dashed lines). During this time, acceleration is 0, which means the velocity is constant (confirmed by the velocity graph). Since velocity is non-zero, the object must be moving, as also confirmed by the distance-vs-time graph. In this particular case, v=16 m/s. (27 Sep 2010: Although that may not be so obvious from this graph, take note that the acceleration is pretty clearly a constant 4m/s2 which, assuming that the first dashed line occurs at t=4, implies a final velocity of 16m/s). By looking at the distance-vs-time graph, it is (perhaps not-so) obvious that during that 3-second span, the object has moved from d1=32m to d2=80m. This makes sense, since in 3 seconds at a speed of 16 m/s, the object should have traveled 48 m (16m/s * 3s = 48m), and thus the final position would be 32m + 48m = 80m. But notice also that the area of the graph between t=4s and t=7s on the velocity graph is a rectangle, and it’s area is (7s – 4s) * 16m/s = 48m! Amazing! That result holds true for all velocity graphs to describe the distance traveled during that time period. Note that this is distinctly different from specifying the actual position of the object. |
![]()
The really nice thing about using this method is that at least in High School Physics, we are almost always dealing with constant-acceleration problems, which means that the velocity graph is always linear (although with possibly varying slopes) and thus determining the distance travelled can easily be accomplished by calculating area from the velocity graph using geometric forms (rectangles and triangles).
Example
Here’s a example of a problem that can be harder to solve using equations that highlights how easy and useful this method can be. The problem is one that was given to me by a student in a High School Physics class.
Q: A bicyclist accelerates at a constant rate for a period of 4.5 seconds, after which his speed is 7.5 m/s. During that time, the bicycle traveled 19m. What was his original speed?
A: Using standard equations to solve this can be a bit difficult, because you don’t know the acceleration, and you don’t know the original velocity to calculate acceleration.
Standard equations:
None of these can be used individually to solve the problem, although they can be combined to solve the problem (see below). However, the answer seems immediately apparent when you visualize the velocity graph and rephrase the problem in terms of finding the shaded area:

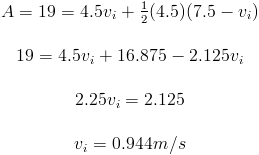
This graph shows the velocity starting at about v=2 m/s, but that is only a guess. The goal of course is that we want to solve for the original velocity. Using the concept that the distance traveled is the area under the graph, this leads us to an easy solution, shown below. The solution breaks the area into two parts – the rectangular area (boxed in the graph above) and the triangular area that sits on top of the boxed area.

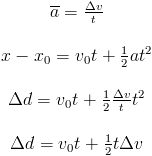
In fact, the solution that we have used can be seen by modifying the first standard equation, and assuming constant accelaration (![]() ):
):

The last equation clearly shows the geometrical form of the answer:
| A = Length * Height – The rectangular part of the velocity area graph, where the width is the time traveled (t) and the height is the initial velocity | |
| A = ½ Base * Height – The triangular part of the velocity area graph, where the base is the the time traveled (t) and the height is the change in velocity |
Other Related Questions
Q1: Is it possible to calculate distance traveled using only acceleration?
A: No – you have to have some information about the velocity. But if you at least know the velocity at any point during the movement (usually initial or final velocity), then that is enough if you have full information about acceleration.
Q2: Is it possible to have zero acceleration and non-zero velocity?
A: By definition, zero-acceleration means “constant velocity”, but that velocity can be any number. So yes, you can have zero acceleration and non-zero velocity.
Q3: Ok this is great for piecewise constant acceleration, but what about non-constant acceleration?
A: The fundamental idea is the same – that the distance traveled is the area under the curve of the velocity graph. With non-constant acceleration this means that the velocity graph will be curved. To solve this problem requires calculus.
Q4: If distance traveled is the area under the velocity curve, is there a relation between the velocity and acceleration graphs?
A: YES! The relation is exactly the same. The area under the acceleration graph represents the change in velocity, just like the area under the velocity graph represents the change in distance.
References
Motion graph obtained from: http://hyperphysics.phy-astr.gsu.edu/hbase/mechanics/motgraph.html [Fair Use]
Change Log
| 15 Sep 2010 | – Original publication |
| 27 Sep 2010 | – Added the “Other Related Questions” section with Q1 – Q4 – Made corrections to the exact speed/distance measurements in the initial graph – Added observation about geometric form of example solution – Converted linked images to embedded images – Adjusted header formatting |

